
So, you collect postcodes. Now what?
Many organisations collect postcodes from attendees and participants. But turning it into useful insight is not straightforward!
Knowing how many people came from postcode ‘2150’ is not as useful as knowing how many people came from the City of Parramatta Local Government Area, or the Western Sydney region.
But converting postcode data into meaningful insight is tricky, due to differing boundaries of postcodes, suburbs, Local Government Areas (LGAs), regions and States/Territories. For instance, one postcode can sit across two, three or more LGAs.
In this post, we share how you can map your postcode data to LGAs, to access more useful insights. We also share how we can help!
Using the ABS correspondences files
This is where the fun begins! If you’re handy with excel, and have a few days up your sleeve, you can set up your own mapping process in-house.
You can map postcodes to other geographic areas using the ABS correspondences files. These are a set of spreadsheets that list the corresponding LGA for every postcode in Australia. You can also access correspondence files for other geographic categories, like Statistical Areas 1-4.
Remember that the geographic boundaries do change from time to time, so be sure to make sure you have the latest files from the ABS (just give them a call if you’re not sure).
Steps in postcode mapping
Once you’ve located the right correspondences file, follow these steps to turn your postcodes into other geographic categories:
Clean your datafile so you have a list of attendances for each postcode (and check your file for erroneous codes and empty fields)
Download the ABS correspondences file, and insert a new column to the right of each postcode & corresponding LGA.
Use a VLOOKUP formula to add the attendances for each postcode into your correspondences worksheet
Multiply the number of attendances to the % of each postcode in each LGA
In a new sheet, sum the total number of attendances for each LGA (hint: the SUMIF formula can help with this)
Lastly, you can tabulate the total attendances by region (e.g. Western Sydney, West Melbourne) and by State/Territory.
Patternmakers Postcode Analysis package
For those short on time, fear not, we are here to help!
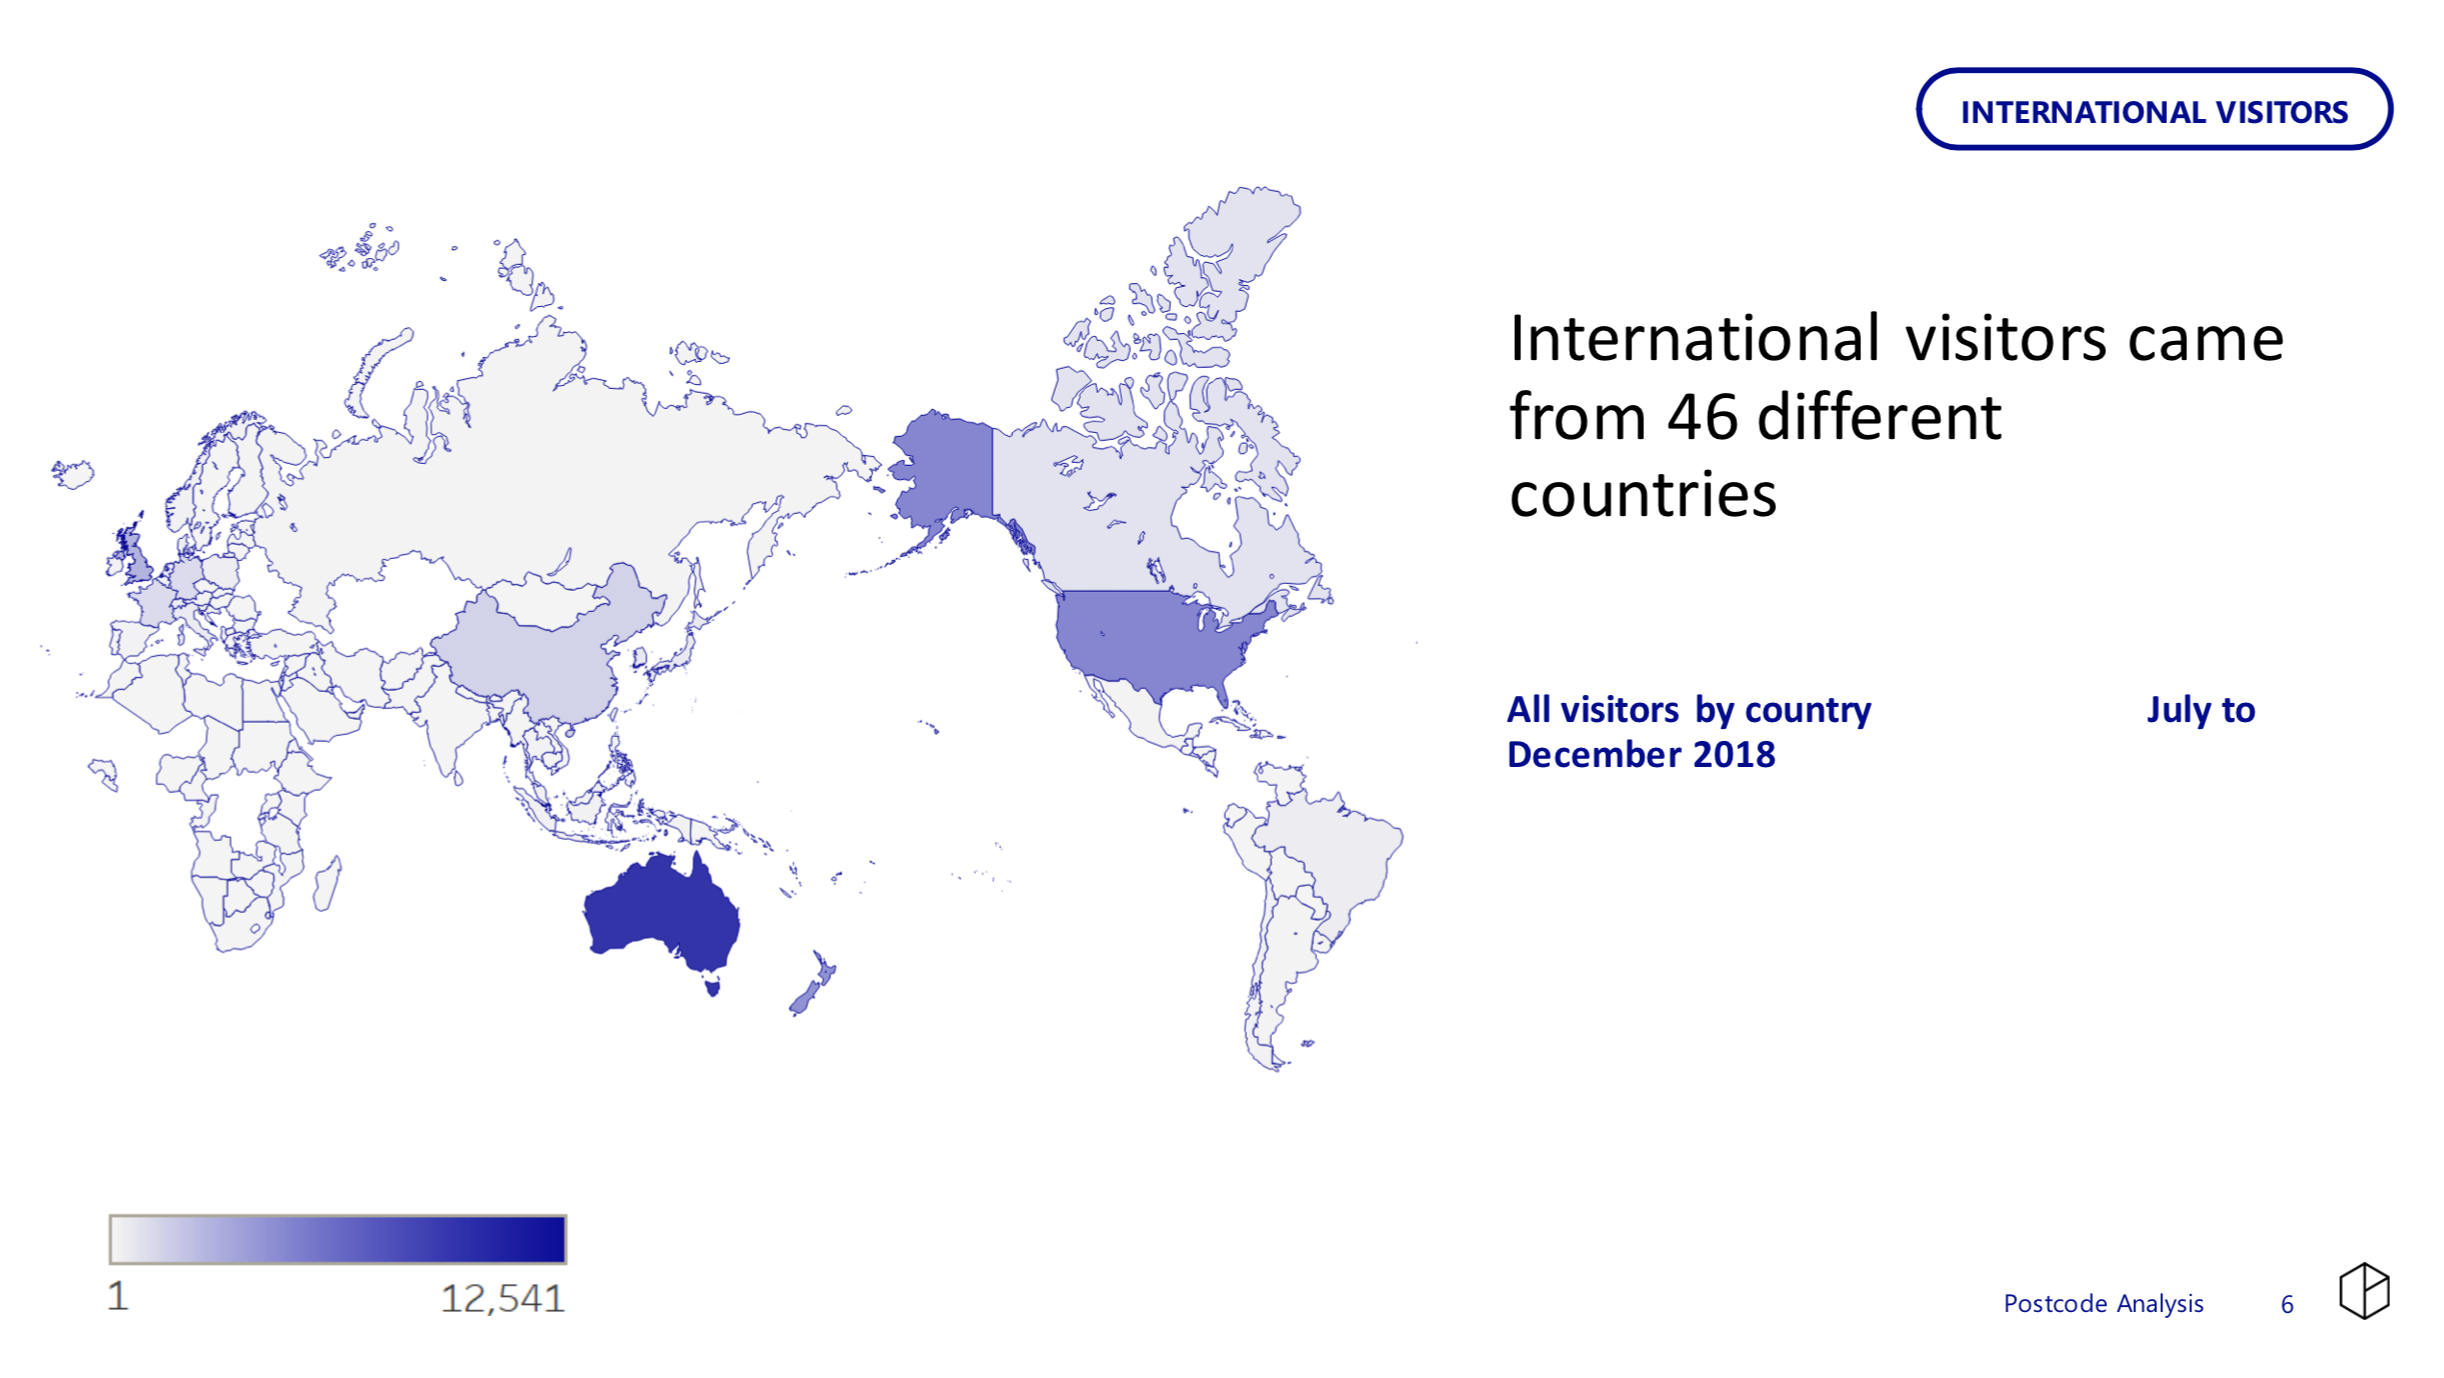
Our Postcode Analysis package delivers meaningful audience and visitor insights by converting postcode data to the regions most important to you and visualising that data using tables, charts and ‘choropleths’ (shaded maps).

This can help you understand your reach and identify ‘blackspots’ where you could grow engagement.
We can also measure how many people travelled from outside your area to experience your work. This can help with reporting your impact in terms of cultural tourism and economic impact.
For example, in 2017, Arts West (an alliance of arts organisations in Melbourne’s West) commissioned Patternmakers to undertake a postcode analysis project. This enabled them to measure their combined reach across Melbourne’s West, and identify opportunities to work together to engage with its diverse communities.
Why postcode mapping is valuable
Packages start at $1,200, depending on how many breakdowns you need, and how frequently you want to report.
This can be a worthwhile investment for some organisations, as it provides:
Provides useful insights for internal and external reporting
Demonstrates your reach across a region of interest, for reporting and advocacy work
Helps to develop campaigns targeted to particular areas and regions
Can free up your time to concentrate on other priorities, if you outsource this work.
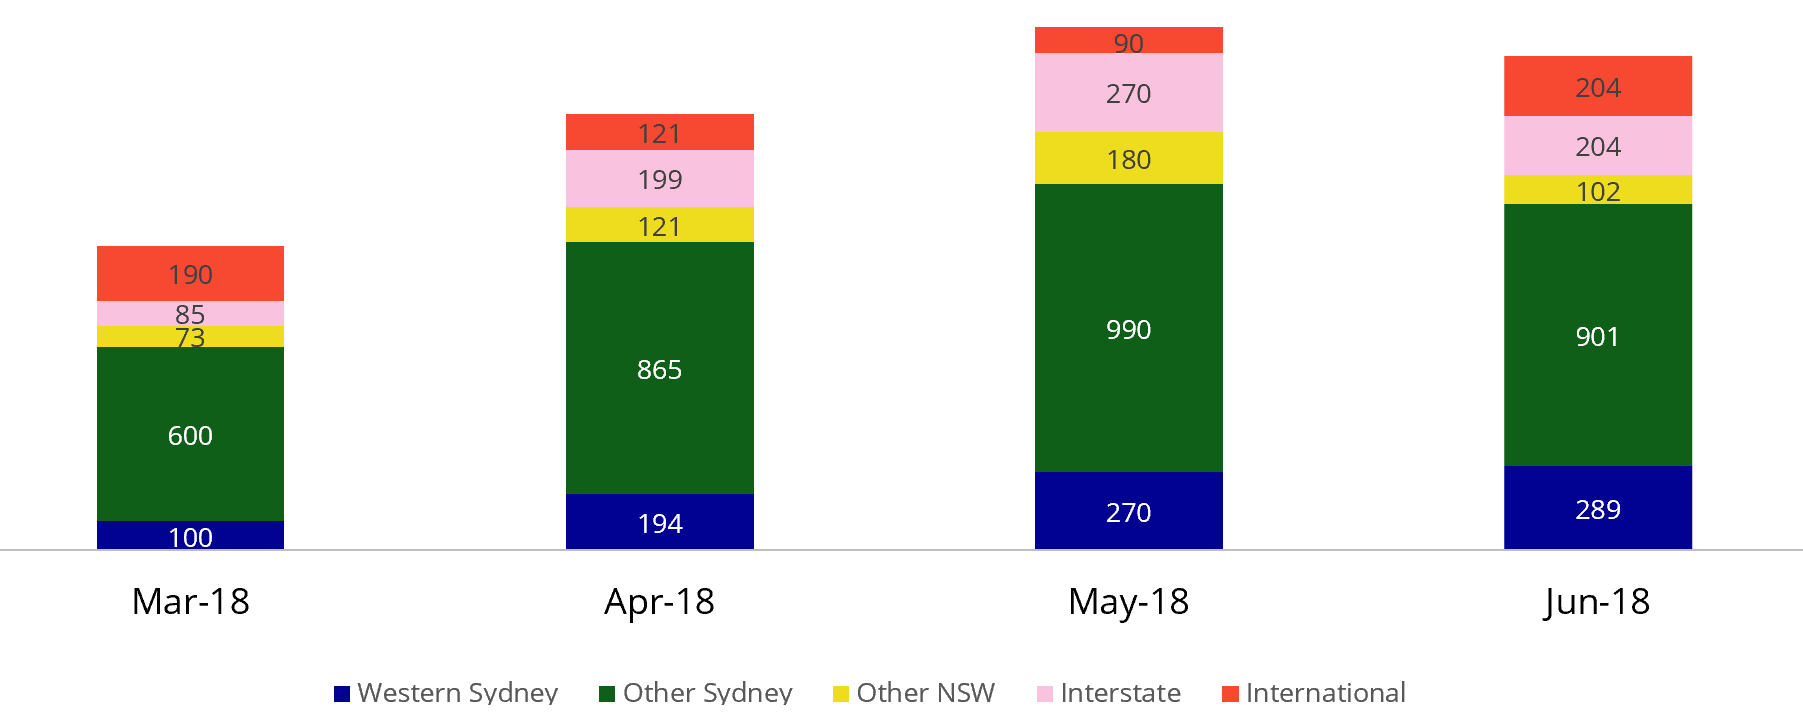
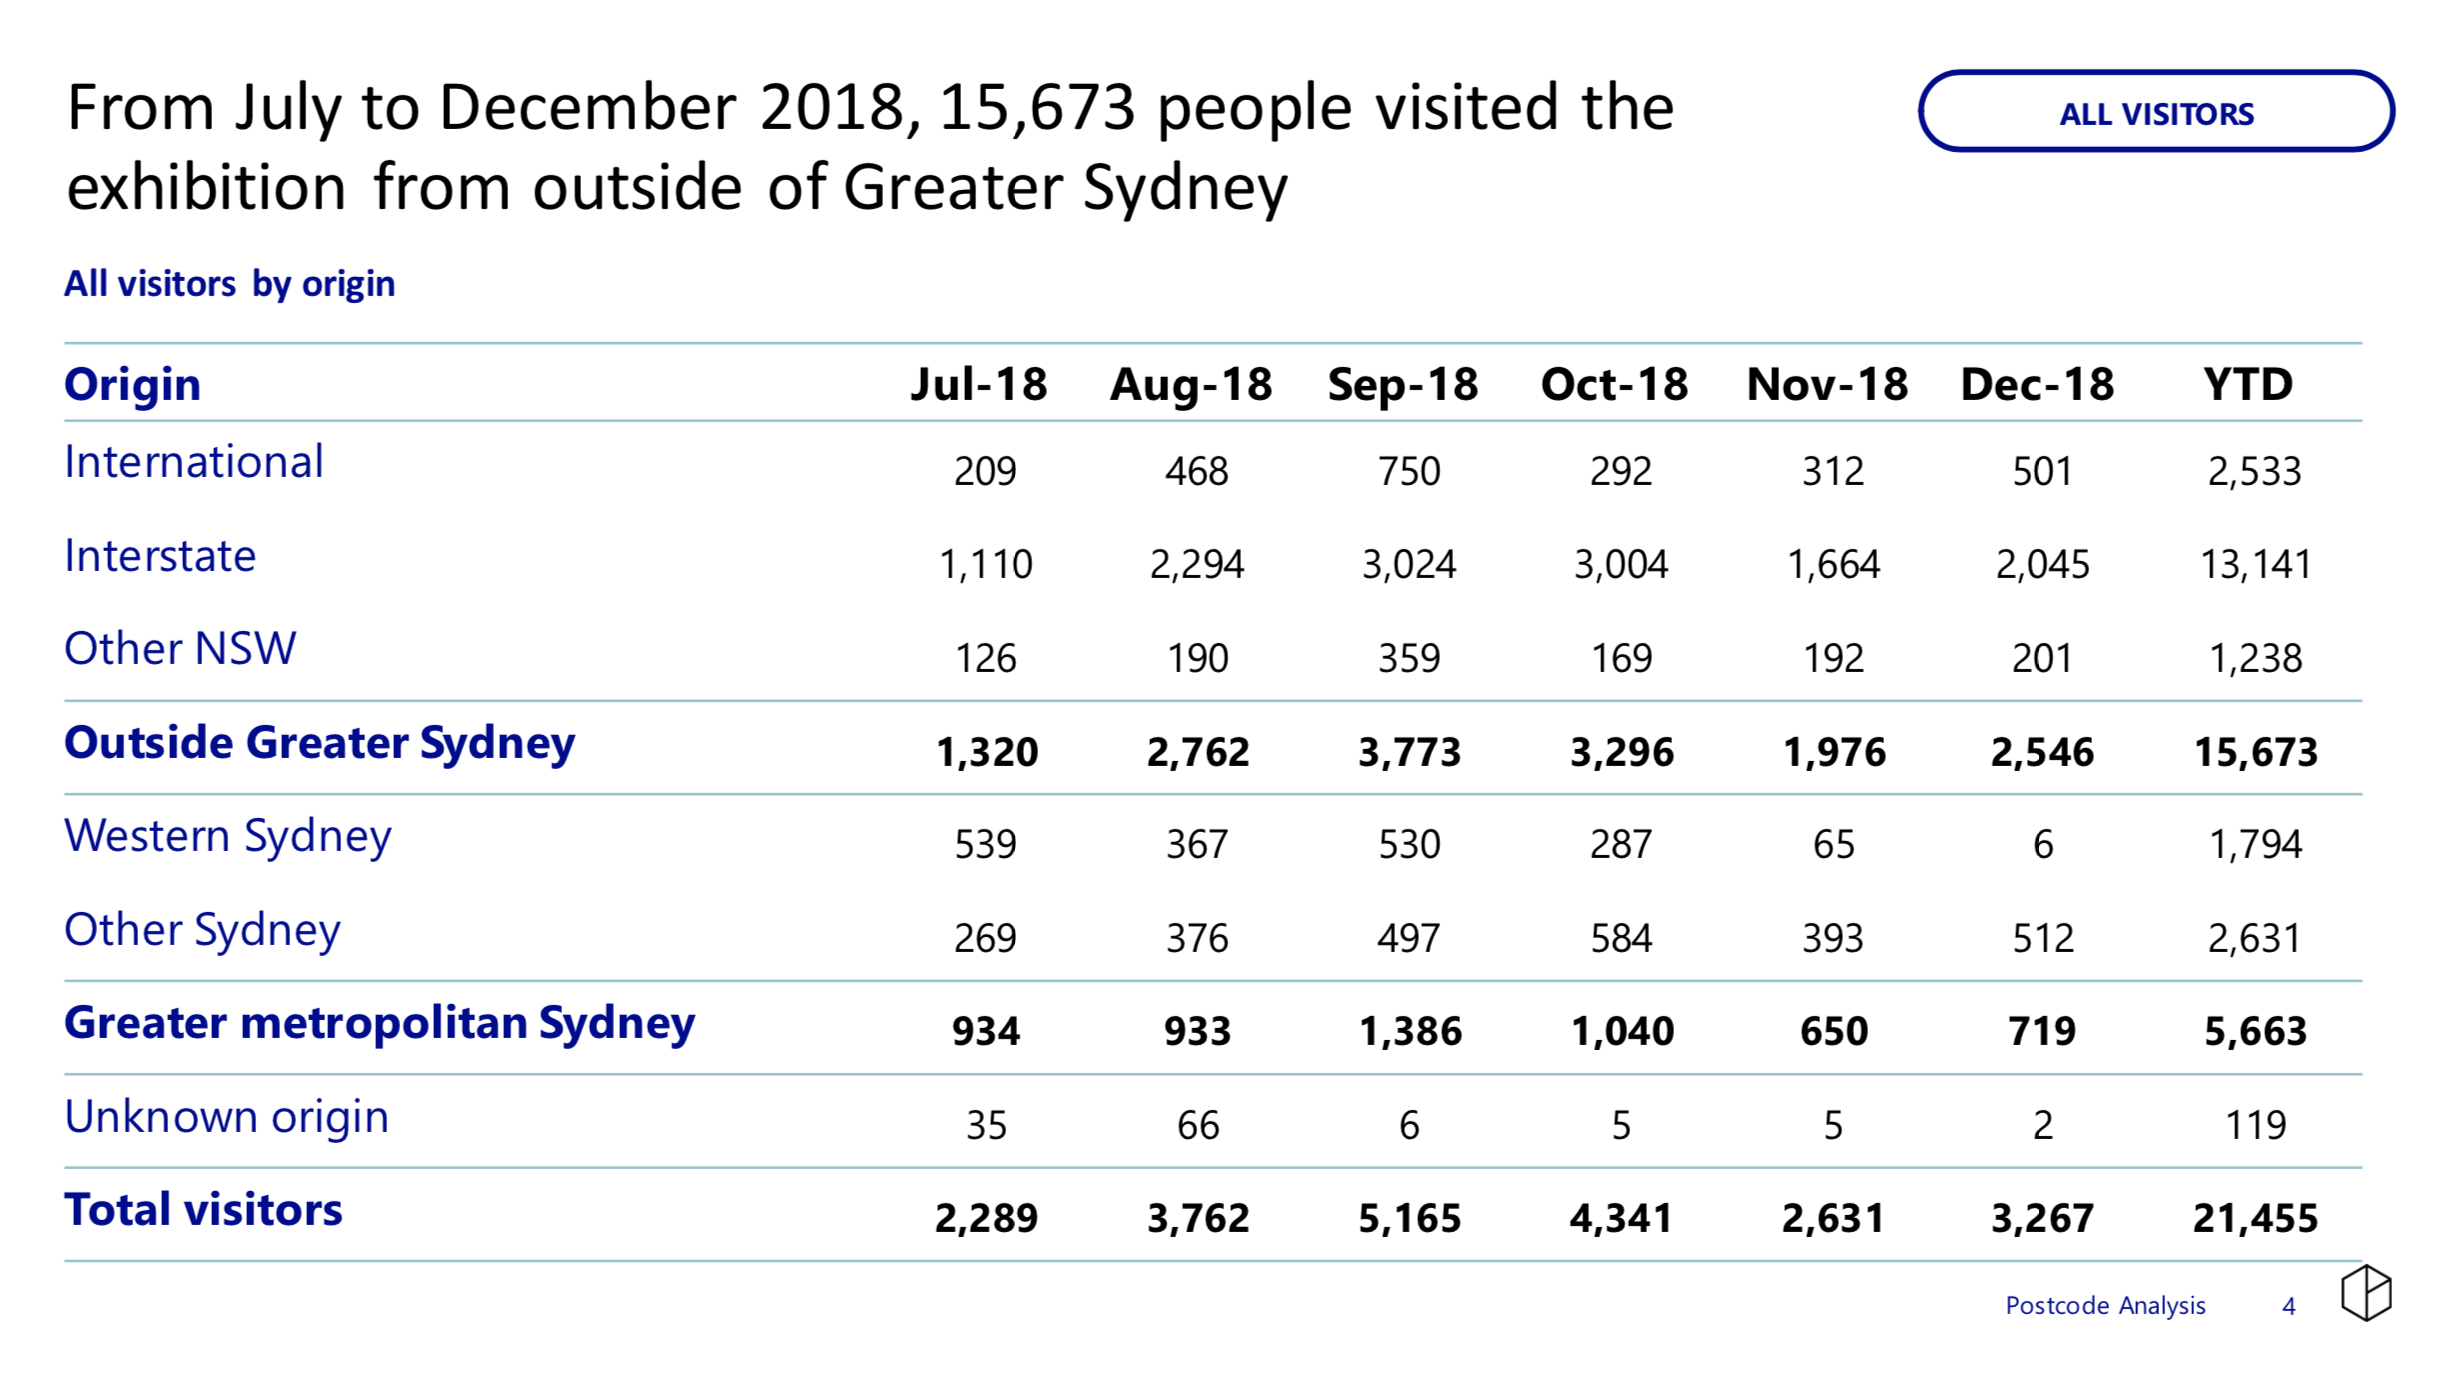
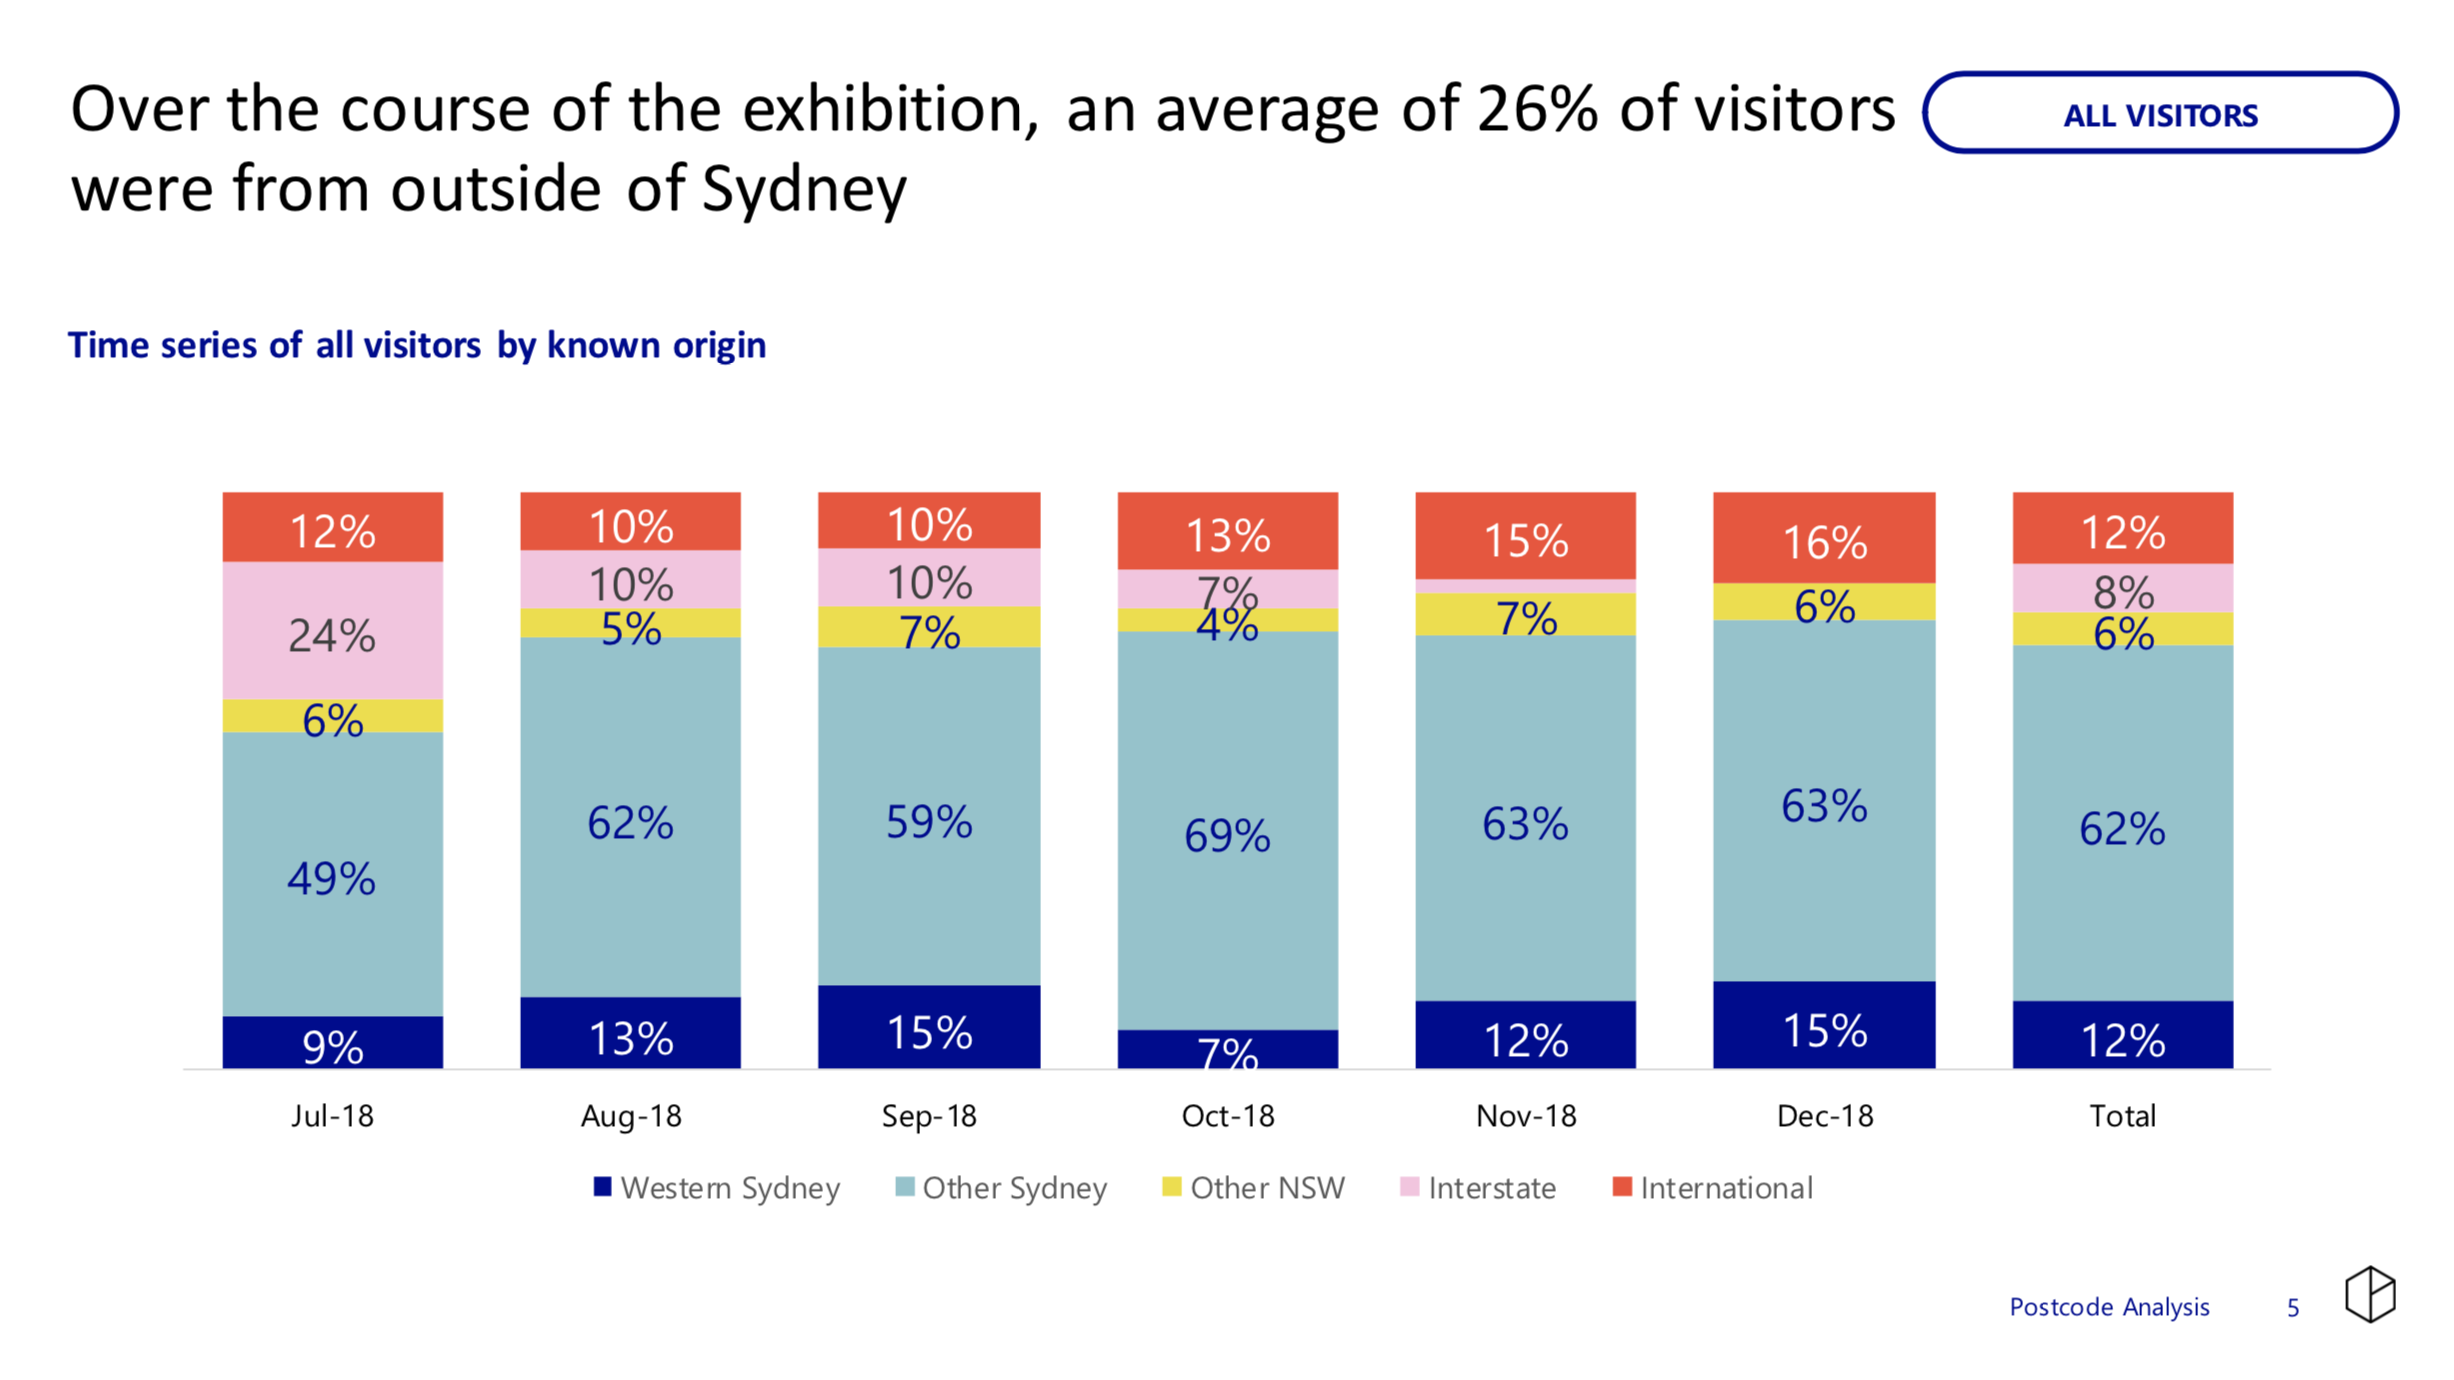
You can download a sample report to see how it looks.
Want to know more?
Click here to request a price list or find out more about DIY mapping.

About the Author
Brooke Boyce
Research Manager
Brooke is experienced in delivering complex quantitative and qualitative research projects, and is our in-house expert on all things methodological.
Categories
- 2016 5
- 2017 8
- 2018 12
- 2019 11
- 2020 3
- 2021 7
- 2022 23
- 2023 21
- 2024 1
- About Patternmakers 35
- Accessibility 4
- Arts 73
- Audience development 79
- Beyond the Bio 8
- COVID-19 70
- Capacity building 3
- Career Advice 9
- Case Studies 2
- Coronavirus 2
- Culture 72
- Culture Panel 1
- Dance 3
- Data art 2
- Data culture 69
- Digital art 4
- Education 2
- Evaluation 75
- First Nations 3
- Indigenous 2
- Innovation 78
- Interviews 3
- Manifesto 1
- Opportunities 4
- Our services 4
- Performing Arts 5
- Postcode Analysis 1
- Privacy 6
- Project updates 25
- Publications 1
- Research 99
- Resources 6
- Strategic Planning 5
- Tandi Palmer Williams 7
- Theory of Creativity Podcast 1
- Thought leadership 16
- Tips & Tricks 13
- Toolkit 5
- Top 5 2
- Touring 3
- Trends 3