
City lights to red dirt: Connecting with audiences across Australia
Our cities, suburbs and regions are different places today and audiences are responding in interesting ways.
Attendees of arts and cultural events are feeling the pressure of the housing crisis, changing work and commuting patterns, navigating weather events and approaching travel and leisure differently.
In this new report, ‘City Lights to Red Dirt’, we look at the geographic trends in data collected from past audiences of cultural events.


Click the buttons below to download the report, as a PDF or accessible Word version, or read on for more of the findings.
Three chapters, three geographic audience segments
The report compares audiences in three main geographic areas, providing insights for connecting people with culture where they live and the places they visit.
Download the chapters as separate fact sheets below.
Audiences in Big Cities
Arts audiences in big cities are experiencing the arts at high levels, but with market saturation and the shifting dynamics of Australia's CBDs post-pandemic, new challenges have emerged for organisations to cut through.
-
In Australia’s big cities, more people are attending arts events more often, but resident arts organisations are competing in a congested market. The data from past attendees shows that:
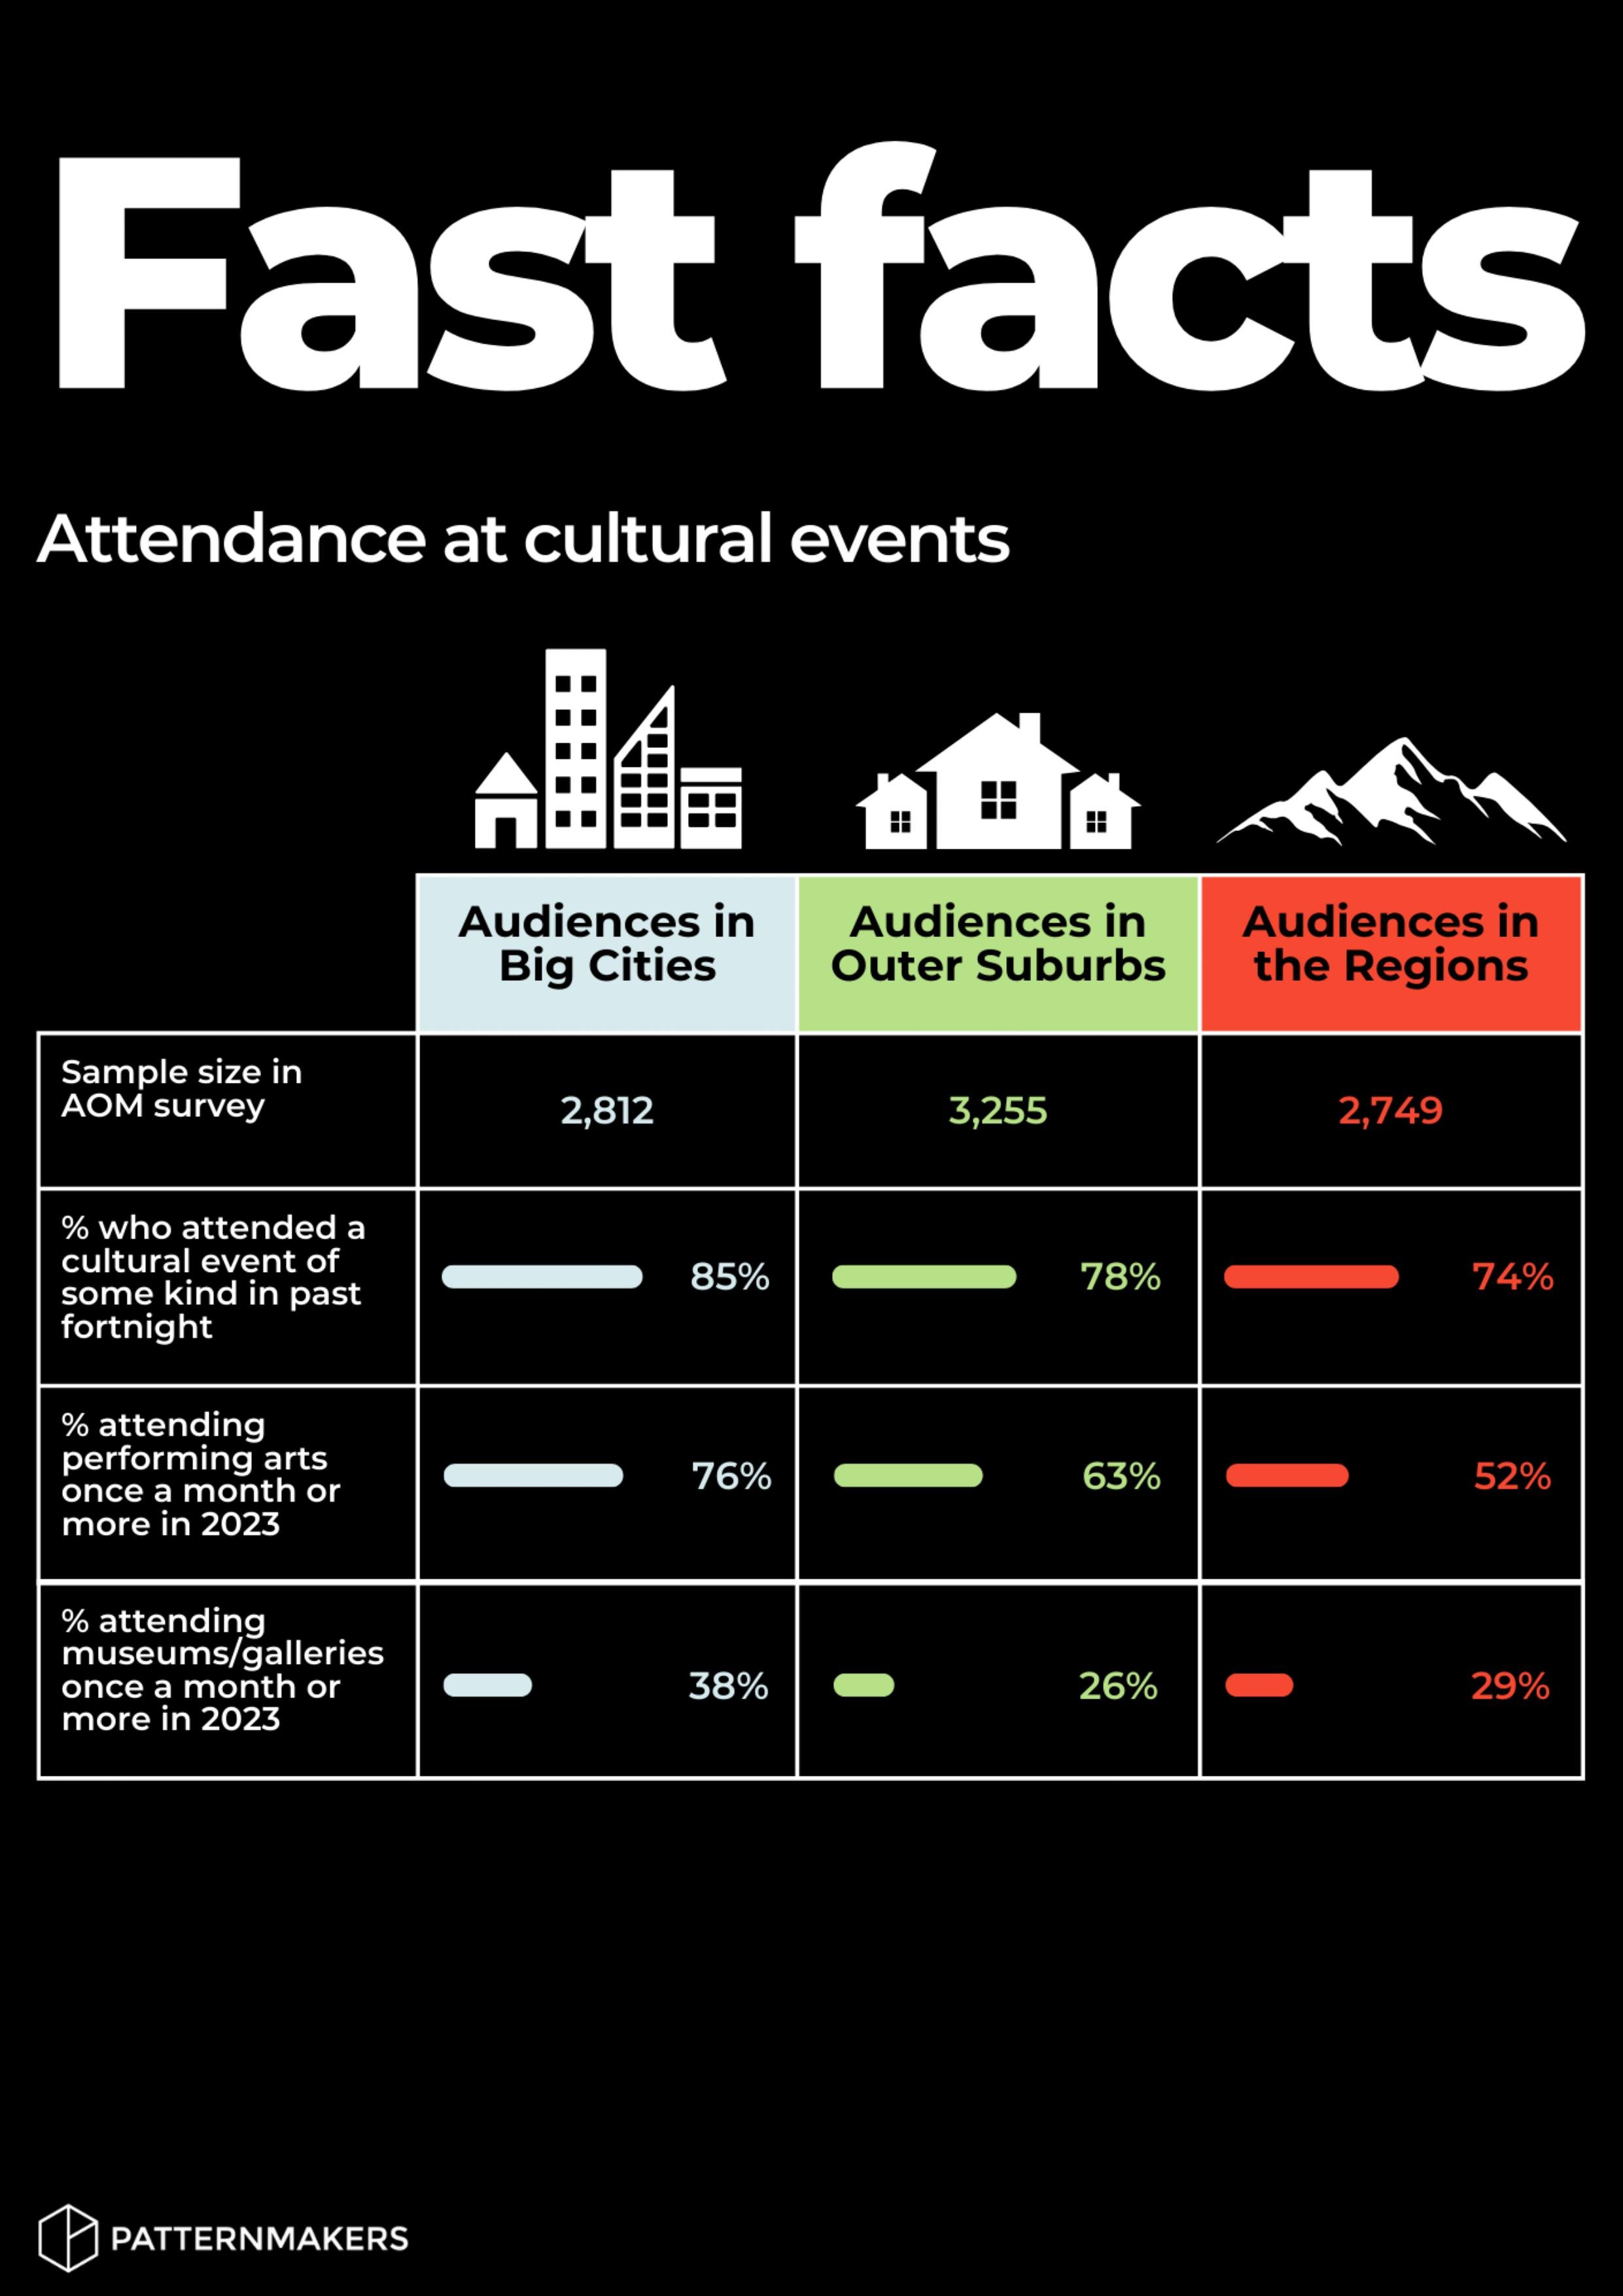
85% of big city audiences said they attended at least one kind of cultural event in the fortnight before data collection. Attendance is also more frequent amongst big city arts audiences: 38% attend a gallery or museum at least once a month, compared to outer suburbs (27%) and regional audiences (29%).
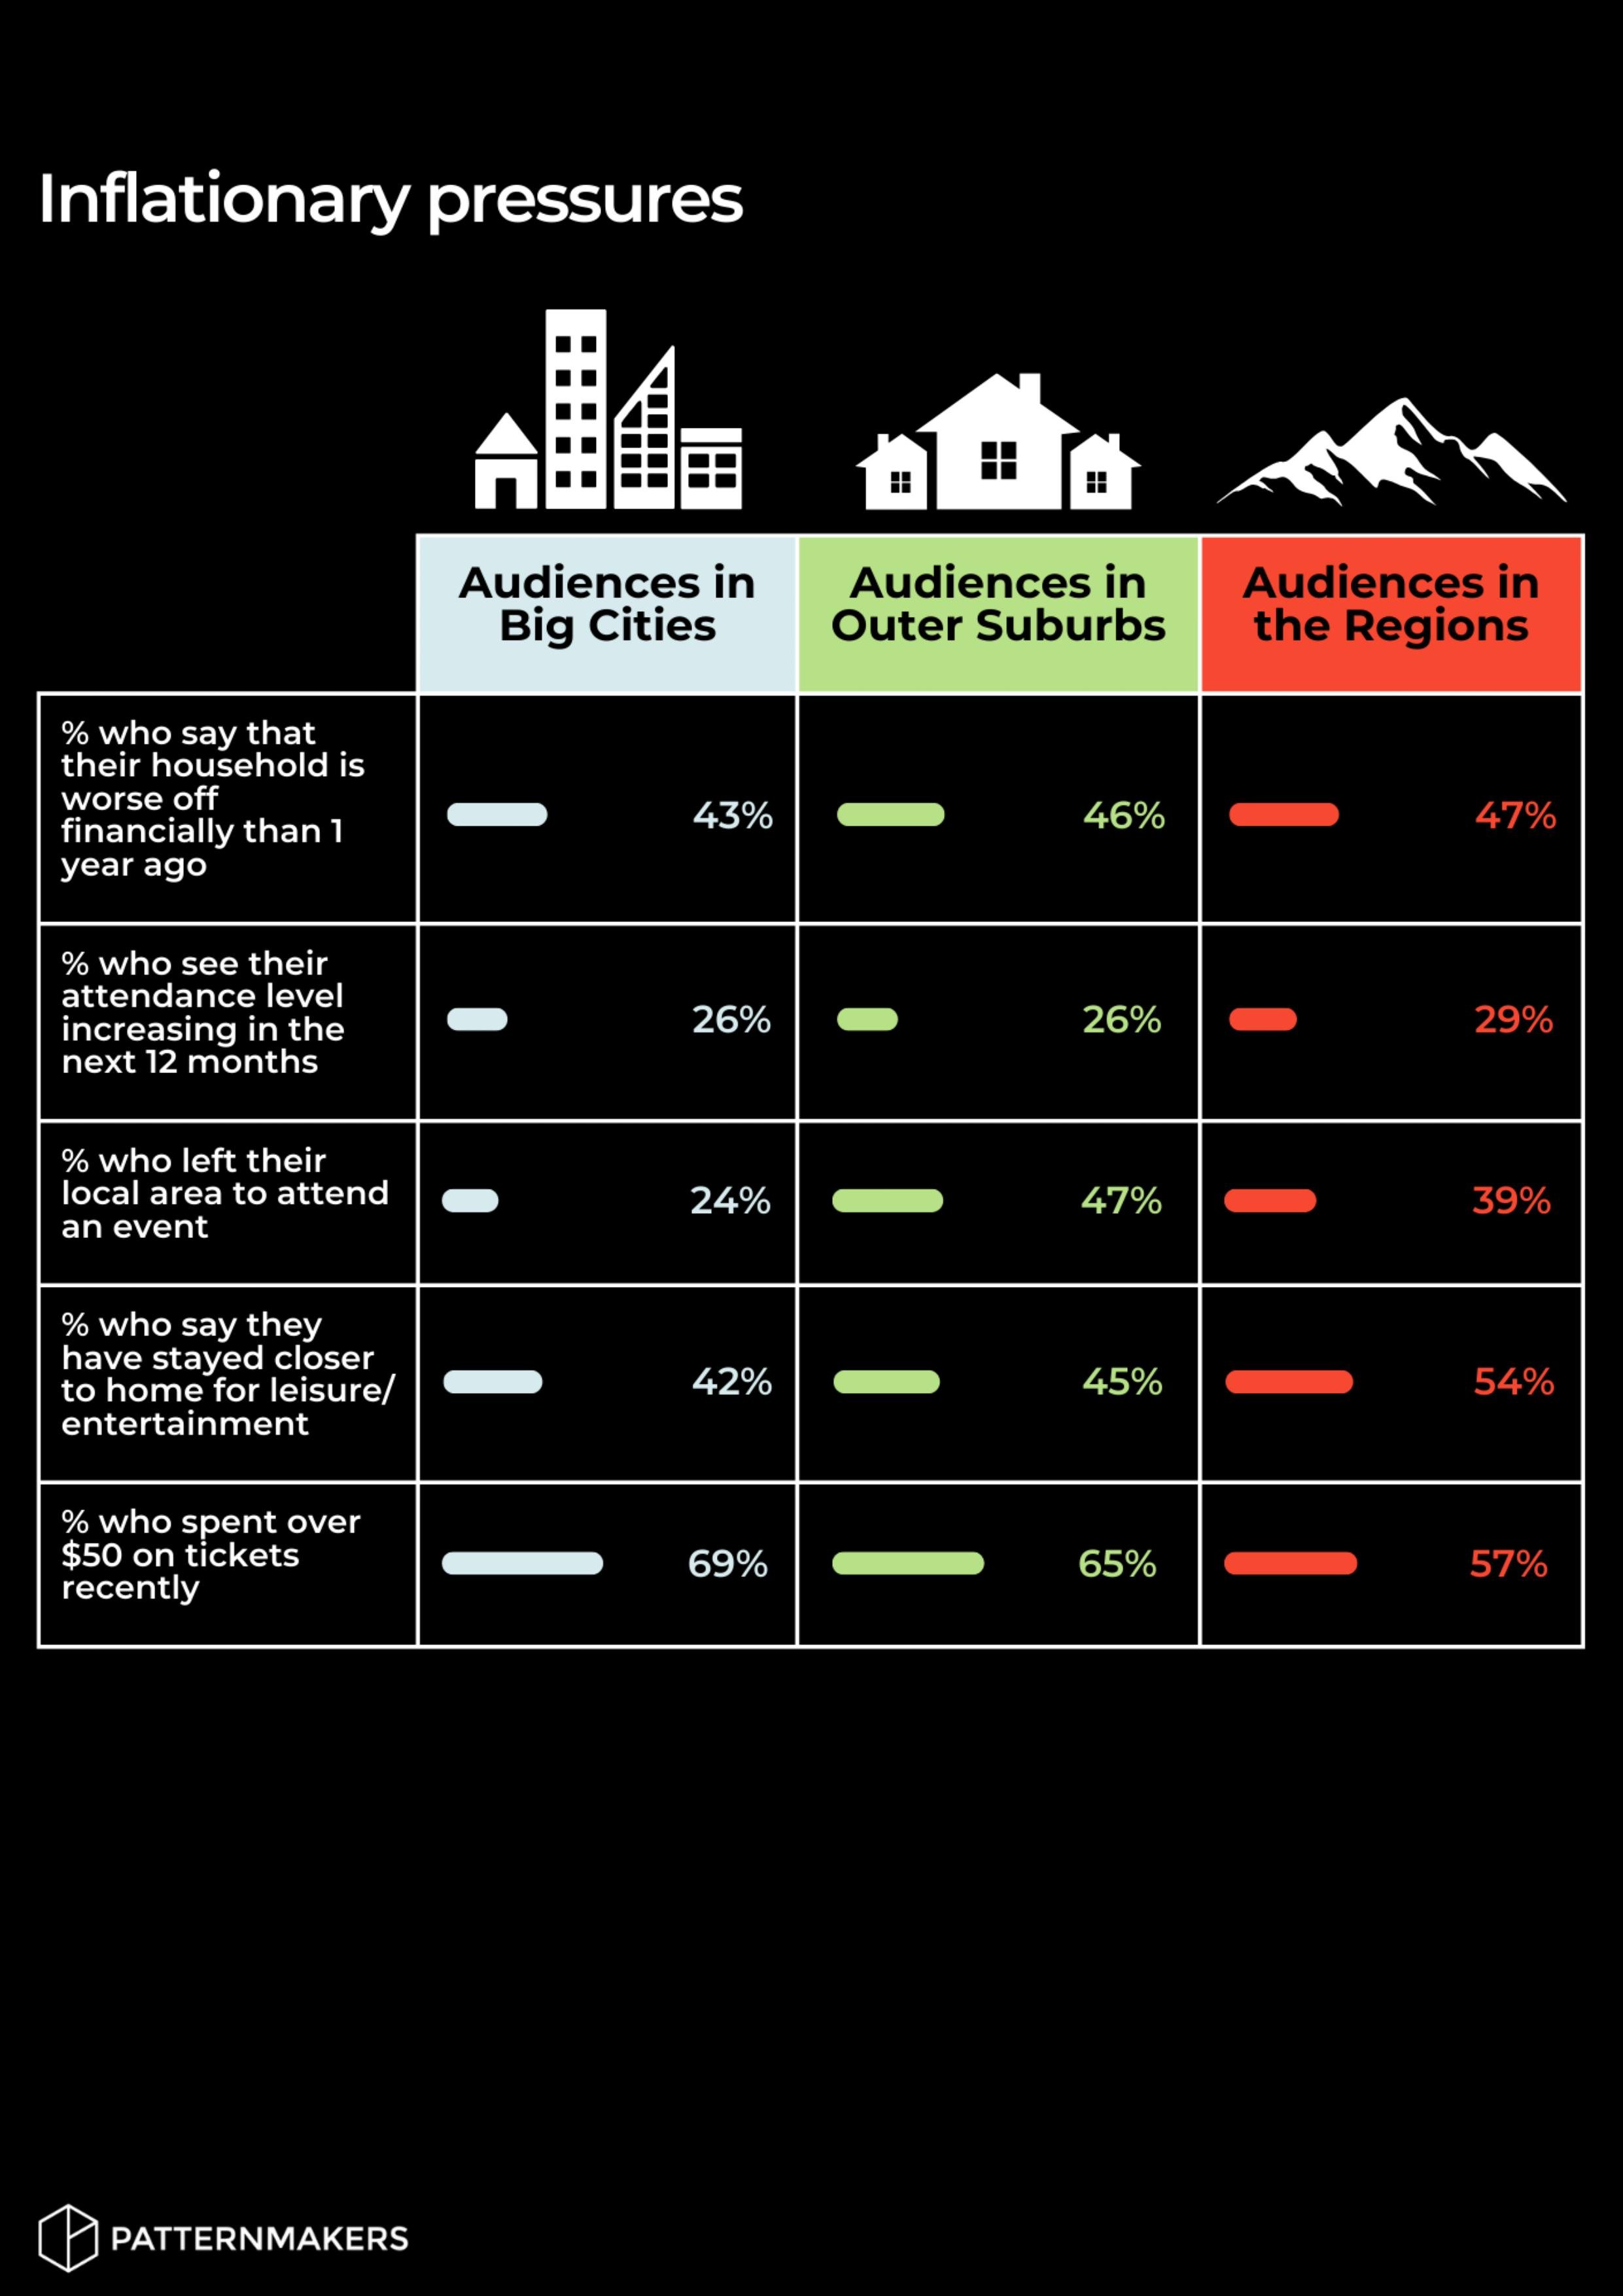
Arts audiences living in big cities are spending more on tickets to in-person live events and cultural activities: 7 in 10 spent more than $50 the fortnight before data collection (69%), compared to 65% of outer suburb audiences and 57% of regional audiences.
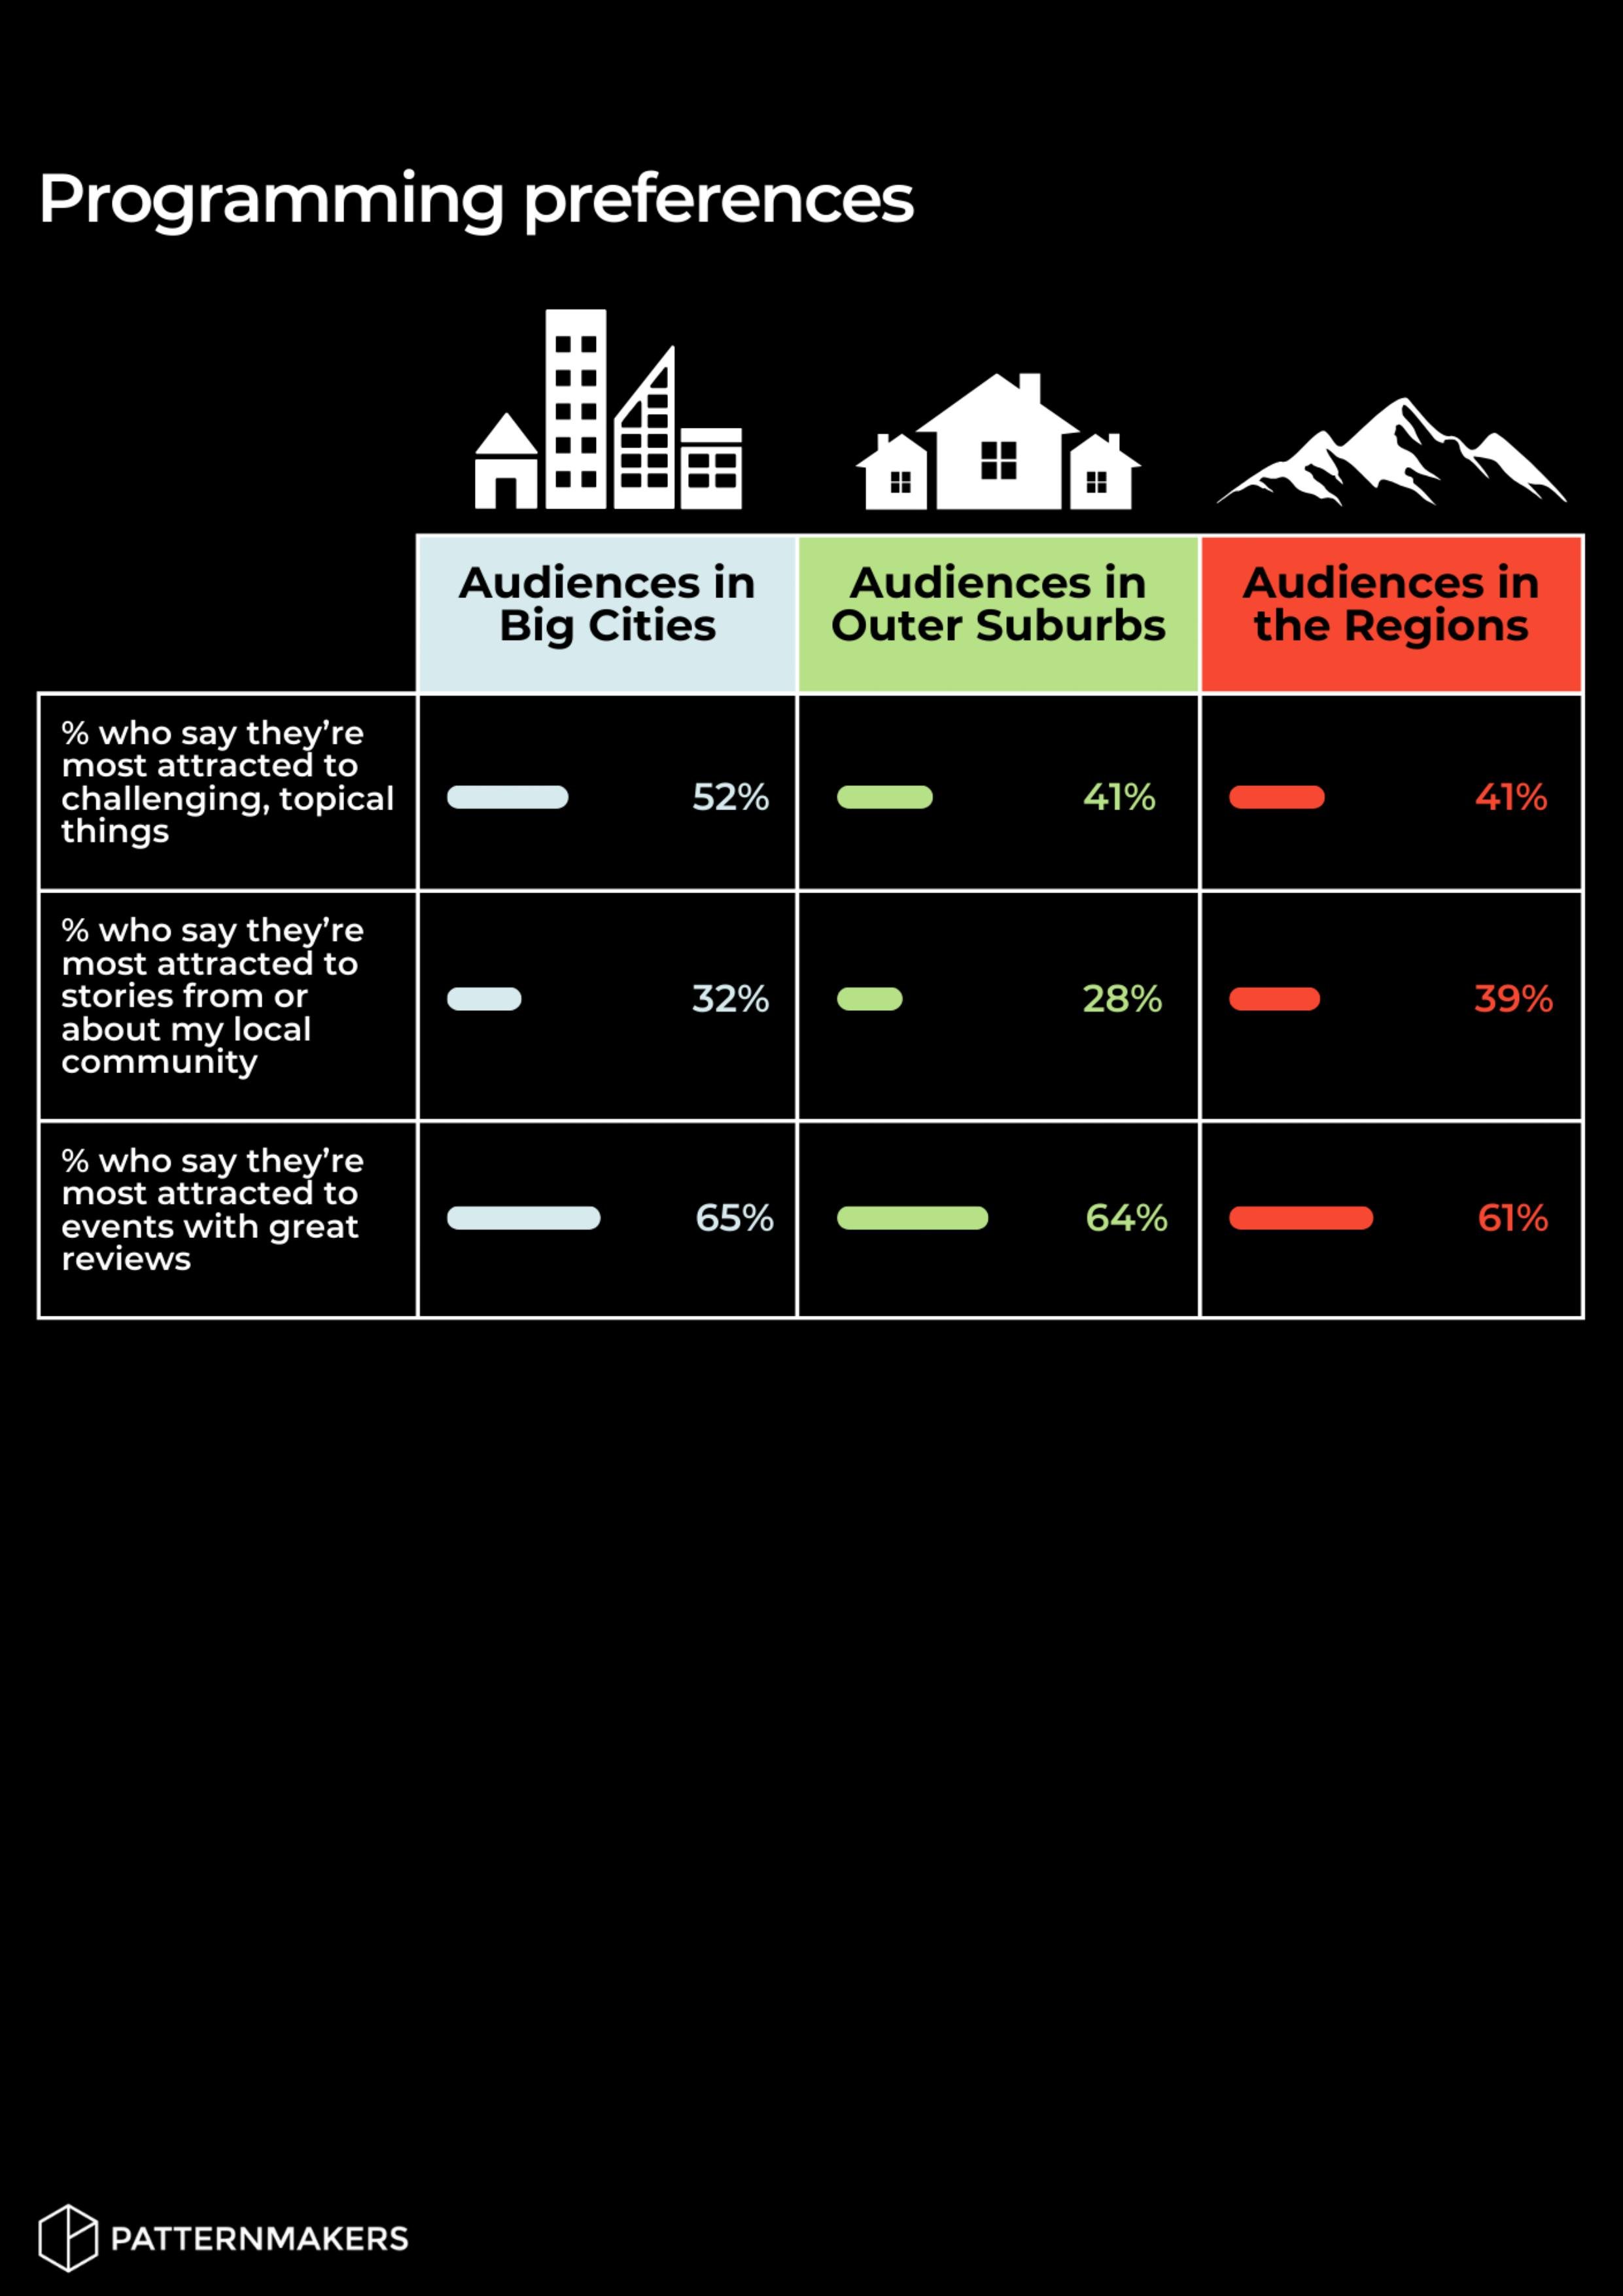
While most audiences are drawn to fun, uplifting and even escapist content right now, big city audiences are showing a greater appetite for challenging, topical content in the next 12 months (52%), compared to audiences living in outer suburbs and regional areas (both 41%). With more options on offer, they are also more likely to tune into reviews when considering what to attend.

Audiences in Outer Suburbs
Outer suburbs are the biggest growth areas in Australia right now, and have an expanding arts audience looking for more cultural experiences closer to home — but don't yet have enough venues nearby to accommodate.
-
In the outskirts and outer suburbs of big cities, the rate and frequency of attendance are slightly lower than big cities, but the market is growing, as more people move to more affordable areas where families can enjoy different lifestyles. The data from past attendees of events shows:
Audiences in outer suburbs are feeling slightly more pessimistic than optimistic about their financial situation, with almost half (46%) say they’re worse off than they were a year ago, and 25% expect to be financially worse off in the coming year.
Audiences in outer suburbs (combining both residents and visitors) were most likely to attend a cinema locally (59%), whereas big city audiences were comparatively more likely to attend a local live performance. Audiences in the regions were most likely to attend a fair/festival locally (40%) or visit a museum or gallery (51%).
Audiences in outer suburban areas are the least likely to be participating in online events right now. Half of outer suburbs residents say online arts events and experiences are playing a small (43%) or substantial role (8%) in their life, while another 49% say they play no role.

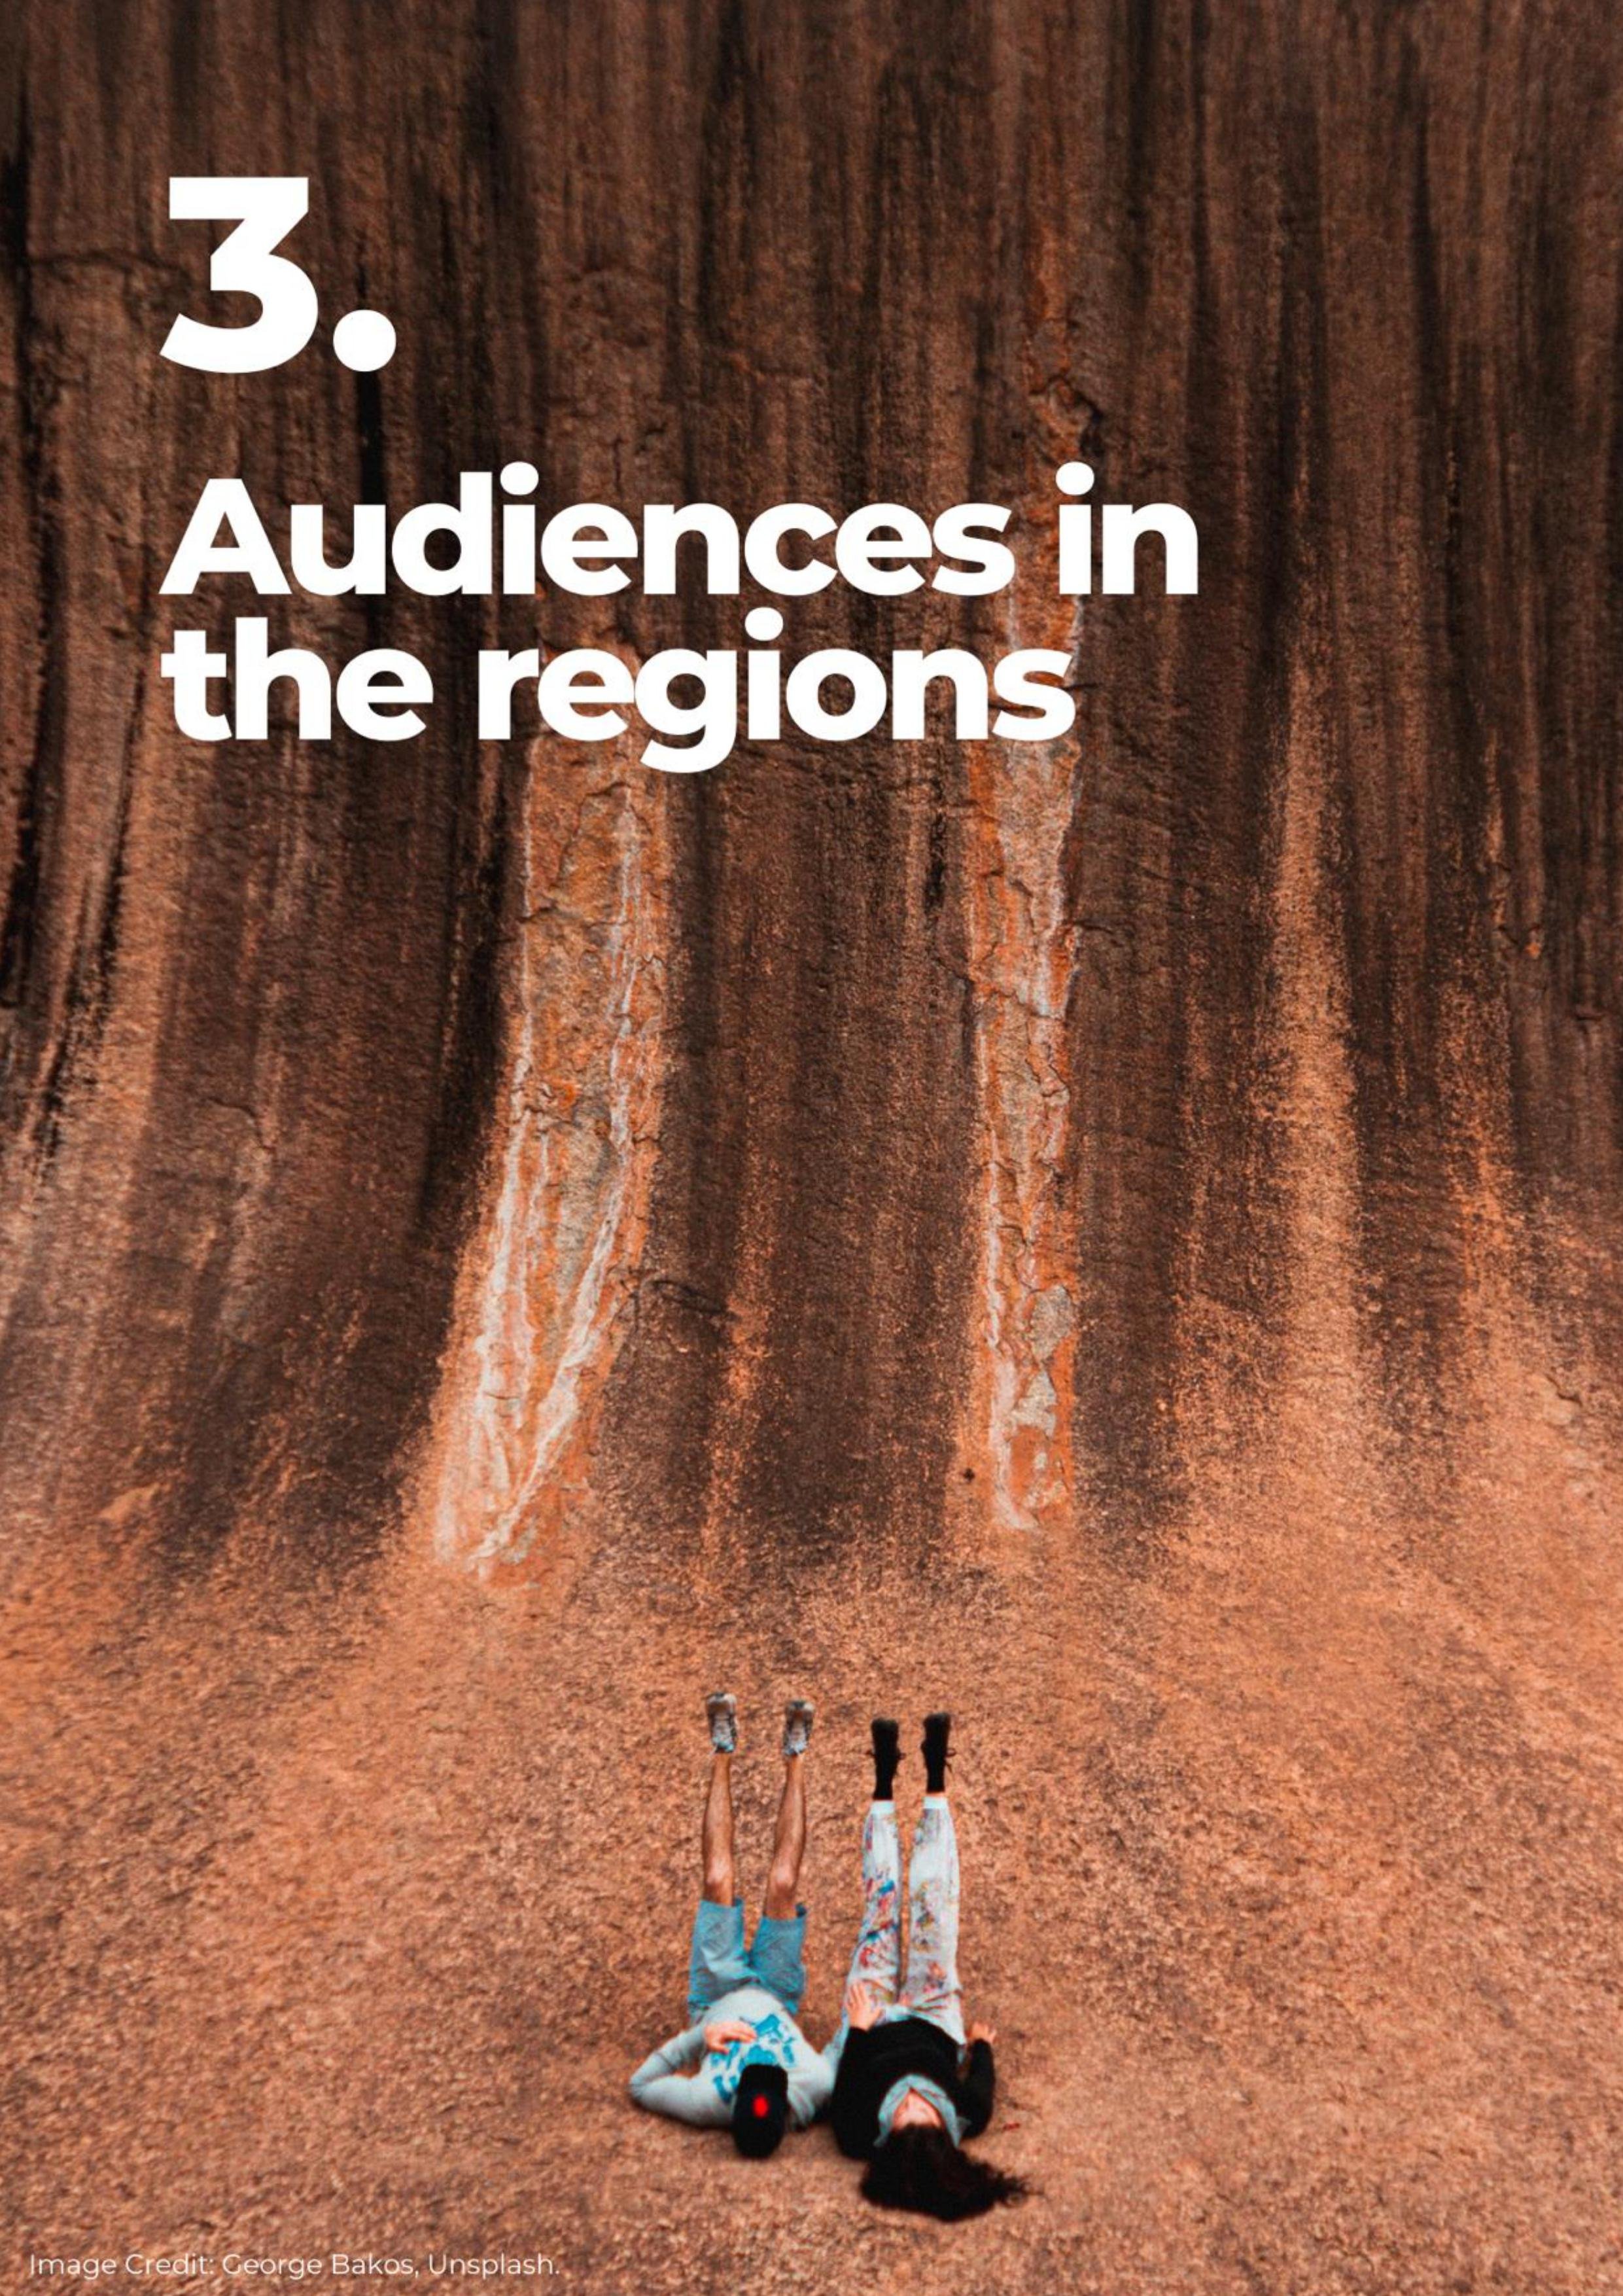
Audiences in the Regions
Across Australia's diverse regions, audiences are experiencing access to arts and culture differently. Factoring in extra time and travel costs means heightened barriers in 2023, but with a decentralising trend, more options could be on the cards.
-
Regional Australia is changing, with demographic shifts seeing some regional places grow dramatically in recent years – but rising costs of travel are leaving some isolated. There are different patterns for large towns, smaller villages and bush or outback areas, but on average, the data shows that:
Regional audiences indicated feeling less stable financially and more pessimistic about their future finances than those in outer suburbs and big cities, and many are being selective about what they attend right now. Almost half (47%) say they are ‘worse off’ financially than they were one year ago, and 26% expect to be ‘worse off’ in the coming year.
Regional audiences have lower levels of access to some types of events, like live performances, and therefore attend less often: 52% of audiences in the regions said they attend performing arts events at least once a month or more, lower than proportions in big cities (77%) and outer suburbs (63%).
Some art forms appear to reach audiences in regional areas better than others. For instance, in the past 12 months, 51% of regional audiences have attended contemporary music and 57% have attended libraries, which are similar to attendance rates in urban areas.
Four in ten regional audience members say that in the coming year, they’ll be most attracted to stories that are ‘about or from my local community’ (39%), slightly higher than the rate in big cities (32%) and outer suburbs (28%).


Get the data at a glance
Click the button below to download our Fast Facts for attendance, inflationary pressures, programming preferences and ticketing and marketing behaviour.

Read the ‘Audiences 2023+’ report
In case you missed it, click the button below for the key insights from the August 2023 National Snapshot.
Use the dashboard to get results for your artform and region
Survey data from Phase 9, which heard from over 8,800 respondents, has been uploaded to the dashboard, which now contains insights from over 100,000 Australian participants.
You can use the dashboard to explore the findings by state/territory, artform and audience segment.
It’s freely available to access, just click the image below and use the login details provided on the dashboard page.

About the Audience Outlook Monitor
The Audience Outlook Monitor provides the results of a study that has tracked audience sentiment over the course of the COVID-19 pandemic.
Data was collected in six phases throughout 2020-2022 and is again being tracked in 2023.
Government agencies across Australia are collaborating with research agencies Patternmakers (Sydney) and WolfBrown (USA) to produce this resource. The dashboard is freely accessible and designed to help artists and cultural organisations of all kinds to make the best possible decisions.

How to find out more
To receive new releases directly into your inbox, as soon as they are available, you can opt in to receive updates below.
If you have a question, or an idea for using this data, please contact Patternmakers at info@thepatternmakers.com.au

About the Author
Peta Petrakis
Research Analyst